Explore Your Career Opportunities
Discover the in-demand job opportunities available after completing this course.
 Mentorship-Driven Career Support
Start your career with the best Data Analytics Course in Indore. Our 16-week bootcamp offers hands-on training in Excel, SQL, Power BI, Python, and more.

already enrolled

655+ ratings
 Learn industry-level skills from experienced professionalsBuild real projects that prove your capabilitiesEarn a certificate that showcases your expertise


Discover the in-demand job opportunities available after completing this course.

From Learning to Earning Your Placement Journey Starts Here
We have achieved an exceptional rating of 4.9 out of 5 stars on Google!
1,000+ people are already part of this community
Students
Rating


 100+
100+

UI UX with AI, Appinventiv

Mastery in UI UX, EncoreSky Technology

UI UX with AI, NewTech Fusion

UI UX with AI, RPM Advertise

UI UX with AI, Kashyap Advertising

MERN Stack, LearnQoch
In just four months, our Data Analytics Course in Indore will equip you with essential skills in Excel, SQL, Python, and Power BI.
You'll gain hands-on experience through real-world projects, mastering data cleaning,.
data visualization, and statistical analysis. By the end of this data analytics training in Indore, you'll have a strong foundation to launch your career with confidence.
Download the brochure to view the detailed curriculum and course flow.
We provide complete career support at every step.

Didn't get the job after course completion? Full refund, No questions asked
Contact Us *Terms & Conditions Apply


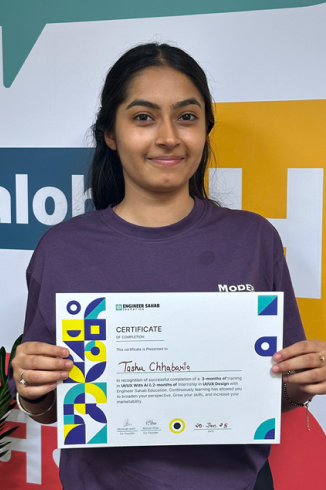
Launching Careers, Shaping Innovators: Our Placements Define the Path to Design Success.
I completed my Data Science course from Engineer Sahab Education recently, and I genuinely had a very good experience. When I joined, I had almost zero knowledge of Python and analytics, but the way the faculty teaches makes everything feel easy and understandable. Classes were practical, not just theory. We worked on real datasets, made dashboards, and even built a couple of ML models by the end of the course. The best part for me was that they never hesitate to repeat anything—doubts are taken seriously.
I joined Engineer Sahab Education for Data Science course and my experience was very good. Mentors are experts and i get full support from institute. The best part is their atmosphere is very good. I will recommend them for Data science and data analytics course in indore.
I completed the Data Science course from Engineersahab Education and had a great experience. The lessons were clear, practical, and easy to understand. It’s a very good institute for beginners. Highly recommended
The Data Science classes were extremely well-structured and beginner-friendly. I gained strong practical skills with hands-on projects and expert guidance throughout.
Many experience in this institute is very good. I done data science course in this institute and this institute provide me solid guidance and interview preparation. overall, good institute for learning data science.
The Data Analytics classes were clear, practical, and easy to follow. I learned valuable tools like Excel, SQL, and Power BI with real-world applications
Data Analytics ki class full paisa vasool thi! Excel, SQL aur Power BI ko itne easy aur mast tareeke se samjha ki maza hi aa gaya, and one to one support bhi rehta hai
I recently completed my Data Science course from Engineer Sahab Education and my experience was very positive. The faculty is very supportive and explains every topic from basic to advanced level. I completed this course online, and my experience with the online classes was very good Anyone can easily attend and learn through the online classes
Expand Your Horizons with These Picks
Transforming Raw Data into Real Insights
 20 Weeks
Check out some frequently asked questions.
No worries if you’re a beginner! This course is designed for freshers and professionals alike. We start from scratch and guide you step by step to build a strong foundation in data analytics.
You’ll learn all the essential tools and techniques like Excel, SQL, Python, data cleaning, data visualization with Power BI, and statistical analysis — along with real-world projects to apply what you learn.
You’ll get hands-on experience with Excel, SQL, Python, Power BI, and popular data analysis libraries — everything you need to confidently step into the world of data analytics.
After completing the course, you can explore roles like Data Analyst, Business Analyst, or even Data Consultant — whether it’s with startups or large companies.
Yes! From portfolio building to resume assistance and interview preparation, we provide full support to help you land your first job in the analytics field
Definitely. Even after the course ends, you’ll be part of our alumni network with access to expert sessions, career guidance, and ongoing support.
Our course fees depend on the format and duration you choose. We offer flexible payment plans so that learners from all backgrounds can join without financial stress.


© 2026 Engineer Sahab Education. All rights reserved.


